Quantcast
Channel: Madhuka
Viewing all 213 articles
Browse latest View live

Building Zeppelin in windows 8

$
0
0

Pre - Requirements

  • java 1.7
  • maven 3.2.x or 3.3.x
  • nodejs
  • npm
  • cywin

Here is my version in windows8 (64 bit)

image

1. Clone git repo

     git clone https://github.com/apache/incubator-zeppelin.git

2. Let’s build Incubator-zeppelin from the source

    mvn clean package

Since you are running in windows shell command or space in dir, new line issue in windows (Unix to dos issue) will break some test so you can skip them for now by ‘-DskipTests’. Used –u to get updated snapshot of the repo while it is building.

Incubator-zeppelin is build success.

image

image

Few issues you can face with windows

ERROR 01

[ERROR] Failed to execute goal com.github.eirslett:frontend-maven-plugin:0.0.23:bower (bower install) on project zeppelin-web: Failed to run task: 'bower --allow-root install' failed. (error code 1) -> [Help 1]

you can find 'bower' in incubator-zeppelin\zeppelin-web folder. So you can go for zeppelin-web directory and enter 'bower install' and wait till it complete.

Some time you will get 'issue in node-gyp' then check you nodejs version and nodejs location is it pointed correctly.

  • $node –version
  • $which node

Then you can get newest version of node-gyp

Some time depending on cywin-user permission you have to install 'bower' if not.

  • npm install -g bower


Error 02

[ERROR] bower json3#~3.3.1  ECMDERR Failed to execute "git ls-remote --tags --heads git://github.com/bestiejs/json3.git", exit code of #128 fatal: unable to connect to github.com: github.com[0: 192.30.252.130]: errno=Connection timed out

Instead to run this command:

  git ls-remote --tags --heads git://github.com/bestiejs/json3.git

you should run this command:
     git ls-remote --tags --heads git@github.com:bestiejs/json3.git
or
    git ls-remote --tags --heads https://github.com/bestiejs/json3.git

or you can run 'git ls-remote --tags --heads git://github.com/bestiejs/json3.git' but you need to make git always use https in this way:

    git config --global url."https://".insteadOf git://

Lot of time this issue occur deu to corporate network / proxy. So we can added proxy settings to git's config and all was well.
    git config --global http.proxy http://proxyuser:proxypwd@proxy.server.com:8080
    git config --global https.proxy https://proxyuser:proxypwd@proxy.server.com:8080


Error 03

You will have fix new line issue in windows. In windows new line is mark as ‘/r/n’.


Bower: Front-end Package Manager

$
0
0

What is bower?

"Web sites are made of lots of things — frameworks, libraries, assets, utilities, and rainbows. Bower manages all these things for you."
Bower is a front-end package manager built by Twitter

Bower works by fetching and installing packages from all over, taking care of hunting, finding, downloading, and saving the stuff you’re looking for. Bower keeps track of these packages in a manifest file, bower.json. How you use packages is up to you. Bower provides hooks to facilitate using packages in your tools and workflows. Bower is optimized for the front-end. Bower uses a flat dependency tree, requiring only one version for each package, reducing page load to a minimum.

Bower is a node module, and can be installed with the following command:
npm install -g bower

Let try to get bootstrap for our web app. Let type.
bower install bootstrap

image

You will get latest version of boostrap and it dependencies as well such as jquery.
You can call for version of bootstrap from
bower install bootstrap#2.2

Those files will reside inside the '/bower_components' folder

You can used them

1<link rel="stylesheet" type="text/css" ref="bower_components/bootstrap/dist/css/bootstrap.css">
2<script src="bower_components/jquery/dist/jquery.js"></script>
3<script src="bower_components/jquery/dist/js/bootstrap.js"></script>

To updating all the packages
bower update


The --save flag will instruct bower to create (if it does not exist) a bower.json file and include the installed packages in it. This is an example of the generated bower.json file:


When any developer who has access to the repository runs bower install, it installs all the dependencies


bower install


bower install jquery#1 bootstrap --save


Build tools: Grunt


Grunt and Gulp are build tools, used to automate common and recurrent tasks, such as minifying scripts, optimizing images, minifying stylesheets, compiling less/sass/stylus. Bower plays well with Grunt/Gulp because of ready made plugins.


Grunt has a plugin called grunt-bower-concat which compiles all the main files for each bower component you have into a bower.js file. Which you can then use Grunt to minify (uglify), resulting in bower.min.js.


Grunt bower concat sample configuration:


1bower_concat:{
2all: {
3dest:"src/js/vendor/bower.js",
4destCss:“src/css/vendor/bower.css”
5 }
6},

Finally think about 'package.json'

1"scripts": {
2"prestart": "npm install",
3"postinstall": "bower update --unsafe-perm",
4"start": "grunt"
5 }

'pre start' is the first command triggered when you run 'npm start'
'post install' is triggered by npm install. This will keep all our front-end packages up to date.
Finally 'start' runs grunt.

AffinityPropagation Clustering Algorithm

$
0
0

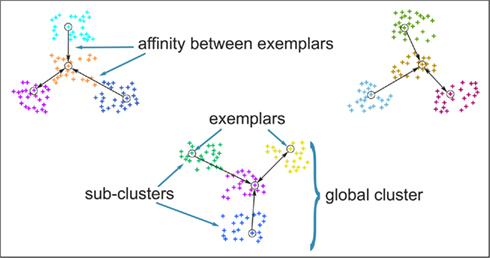
Affinity Propagation (AP)[1] is a relatively new clustering algorithm based on the concept of "message passing" between data points. AP does not require the number of clusters to be determined or estimated before running the algorithm.

“An algorithm that identifies exemplars among data points and forms clusters of datapoints around these exemplars. It operates by simultaneously considering all data point as potential exemplars and exchanging messages between data points until a
good set of exemplars and clusters emerges.”[1]


Let x1 through xn be a set of data points, with no assumptions made about their internal structure, and let s be a function that quantifies the similarity between any two points, such that s(xi, xj) > s(xi, xk) iff xi is more similar to xj than to xk.

Algorithm

The algorithm proceeds by alternating two message passing steps, to update two matrices

  • The "responsibility" matrix R has values r(i, k) that quantify how well-suited xk is to serve as the exemplar for xi, relative to other candidate exemplars for xi.
    • First, responsibility updates by below function

r(i,k) \leftarrow s(i,k) - \max_{k' \neq k} \left\{ a(i,k') + s(i,k') \right\}

  • The "availability" matrix A contains values a(i, k) represents how "appropriate" it would be for xi to pick xk as its exemplar, taking into account other points' preference for xkas an exemplar.
    • Availability is updated
a(i,k) \leftarrow \min \left( 0, r(k,k) + \sum_{i' \not\in \{i,k\}} \max(0, r(i',k)) \right) for i \neq k and
a(k,k) \leftarrow \sum_{i' \neq k} \max(0, r(i',k)).

Input for Algo is {s(i, j)}i,j∈{1,...,N} (data similarities and preferences)

Both matrices are initialized to all zeroes.


Let is Implement the Algorithm.

I will be using python sklearn.cluster.AffinityPropagation. I will using my previously[2] generated data set.

1# Compute Affinity Propagation
2af = AffinityPropagation().fit(X)

Parameters


All parameters are optional


  • damping : Damping factor between 0.5 and 1 (float, default: 0.5)

  • convergence_iter : Number of iterations with no change in the number of estimated clusters (int, optional, default: 15)
    max_iter : Maximum number of iterations. (int, default: 200) 

  • copy : Make a copy of input data (boolean, default: True)

  • preference : Preferences for each point - points with larger values of preferences are more likely to be chosen as exemplars. The number of exemplars, ie. of clusters, is influenced by the input preferences value. If the preferences are not passed as arguments, they will be set to the median of the input similarities. (array-like, shape (n_samples,) or float)

  • affinity : Which affinity to use. At the moment `precomputed` and `euclidean` are supported.  (string, optional, default=`euclidean`)

  • verbose : Whether to be verbose (boolean, default: False)

Implementation can be found in here[4]


Attributes


  • cluster_centers_indices_ : Indices of cluster centers (array)

  • cluster_centers_ : Cluster centers  (array)

  • labels_ : Labels of each point (array)

  • affinity_matrix_ : Stores the affinity matrix used in `fit` (array)

  • n_iter_ : Number of iterations taken to converge (int)

I will be using same result comparison variables that we used for DBSCAN[2]. Charting will be update for AF.  


Estimated number of clusters: 6
Homogeneity: 1.000
Completeness: 0.801
V-measure: 0.890
Adjusted Rand Index: 0.819
Adjusted Mutual Information: 0.799
Silhouette Coefficient: 0.574


image


When data set is more spread (sd) from 0.5 to 0.9 


image


sample dataset center point are [[5, 5], [0, 0], [1, 5],[5, -1]]. Let try to turning algo parameters for to get better clustering


Let is see the effect of iteration in AF


When Iteration is 30                                                                           Iteration Is 75


imageimage


150 Iterations                                                                        200 Iterations


imageimage


Gist : https://gist.github.com/Madhuka/2e27dce9680f42619b83#file-affinity-propagation-py


References


[1] Brendan J. Frey; Delbert Dueck (2007). "Clustering by passing messages between data points". Science 315 (5814): 972–976.


[2] http://madhukaudantha.blogspot.com/2015/04/density-based-clustering-algorithm.html


[3] http://www.cs.columbia.edu/~delbert/docs/DDueck-thesis_small.pdf


[4] https://github.com/scikit-learn/scikit-learn/blob/master/sklearn/cluster/affinity_propagation_.py#L256

Natural Language Toolkit (NLTK) sample and tutorial - 01

$
0
0

What is NLTK?

Natural Language Toolkit (NLTK) is a leading platform for building Python programs to work with human language data (Natural Language Processing). It is accompanied by a book that explains the underlying concepts behind the language processing tasks supported by the toolkit. NLTK is intended to support research and teaching in NLP or closely related areas, including empirical linguistics, cognitive science, artificial intelligence, information retrieval, and machine learning.

Library contains

  • Lexical analysis: Word and text tokenizer
  • n-gram and collocations
  • Part-of-speech tagger
  • Tree model and Text chunker for capturing
  • Named-entity recognition

Download and Install

1. You can download NLTK from here in windows

2. Once NLTK is installed, start up the Python interpreter to install the data required for rest of the work.

1import nltk
2nltk.download()

image


It consists of about 30 compressed files requiring about 100Mb disk space. If any disk space issue or network issue you can pick only you need.


Once the data is downloaded to your machine, you can load some of it using the Python interpreter.


1from nltk.book import*

image


Basic Operation in Text


1from__future__import division
2from nltk.book import*
3
4
5#Enter their names to find out about these texts
6print text3
7#Length of a text from start to finish, in terms of the words and punctuation symbols that appear.
8print'Length of Text: '+str(len(text3))
9
10#Text is just the set of tokens
11#print sorted(set(text3))
12print'Length of Token: '+str(len(set(text3)))
13
14#lexical richness of the text
15def lexical_richness(text):
16return len(set(text)) / len(text)
17
18#percentage of the text is taken up by a specific word
19def percentage(word, text):
20return (100* text.count(word) / len(text))
21
22print'Lexical richness of the text: '+str(lexical_richness(text3))
23print'Percentage: '+ str(percentage('God',text3));

Now we will pick ‘text3’ called '”The Book of Genesis” for try NLTK features. Above code sample is showing


  • Name of the Text

  • The length of a text from starting to end

  • Token count of the text. (A token is the technical name for a sequence of characters. Text is just the set of tokens that it uses, since in a set, all duplicates are collapsed together.)

  • Calculate a measure of the lexical richness of the text (number of distinct words by total number of words)

  • How often a word occurs in a text (compute what percentage of the text is taken up by a specific word)

Note
In Python 2, to start with from __future__ import for division.


Output of above code snippet


image


Searching Text


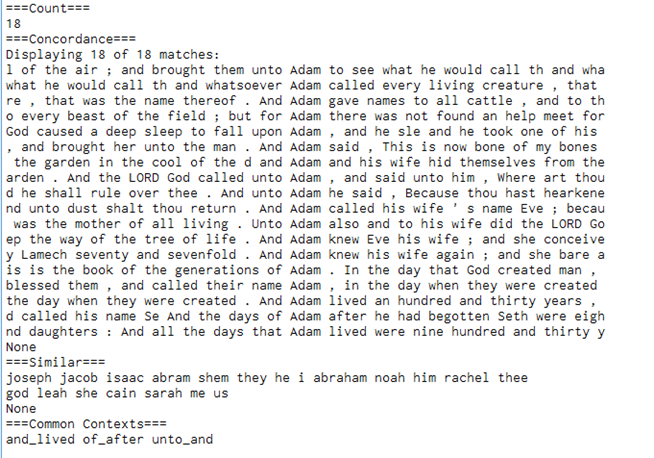
  • Count(word) - support count the word in the text

  • Concordance(word) - give every occurrence of a given word, together with some context.

  • Similar(word) - appending the term similar to the name of the text

  • Common_contexts([word]) - contexts are shared by two or more words

1from nltk.book import*
2
3#names of the Text
4print text3
5
6#count the word in the Text
7print"===Count==="
8print text3.count("Adam")
9
10#'concordance()' view shows us every occurrence of a given word, together with some context.
11#Here 'Adam' search in 'The Book of Genesis'
12print"===Concordance==="
13print text3.concordance("Adam")
14
15#Appending the term similar to the name of the text
16print"===Similar==="
17print text3.similar("Adam")
18
19#Contexts are shared by two or more words
20print"===Common Contexts==="
21text3.common_contexts(["Adam", "Noah"])

output of the code sample


image


Now I need plot word that are distributing over the text. Such as "God","Adam", "Eve", "Noah", "Abram","Sarah", "Joseph", "Shem", "Isaac" word are place in the text/book.


1text3.dispersion_plot(["God","Adam", "Eve", "Noah", "Abram","Sarah", "Joseph", "Shem", "Isaac"])

image


References


[1] Bird, Steven; Klein, Ewan; Loper, Edward (2009). Natural Language Processing with Python. O'Reilly Media Inc. ISBN 0-596-51649-5.

NLTK tutorial–02 (Texts as Lists of Words / Frequency words)

$
0
0

Previous post was  basically about installing and introduction for NLTK and searching text with NLTK basic functions. This post main going on ‘Texts as Lists of Words’ as text is nothing more than a sequence of words and punctuation.  Frequency Distribution also visited at the end of this post.

sent1 = ['Today', 'I', 'call', 'James', '.']

len(sent1)—> 4

  • Concatenation combines the lists together into a single list. We can concatenate sentences to build up a text.
    text1 = sent1 + sent2
  • Index the text to find the word in the index. (indexes start from zero)
    text1[12]
  • We can do the converse; given a word, find the index of when it first occurs
    text1.index('call')
  • Slicing the text(By convention, m:n means elements m…n-1)
    text1[165:198]
    • NOTE
      If accidentally we use an index that is too large, we get an error: 'IndexError: list index out of range'
  • Sorting
    noun_phrase = text5[1:6]
    sorted(noun_phrase)

NOTE
Remember that capitalized words appear before lowercase words in sorted lists


Strings

Few to play with String in python. These are very basic but usefull to know when you are work with NLP.
name = 'Madhuka'
name[0] --> 'M'
name[:5] --> 'Madhu'
name * 2 --> 'MadhukaMadhuka'
name + '.' --> 'Madhuka.'

Splitting and join
''.join(['NLTK', 'Python']) --> 'NLTL Python'
'NLTL Python'.split() --> ['NLTK', 'Python']


Frequency Distributions

Text contains frequency distributed words. NLTK provides built-in support for them. Let's use a FreqDist to find the 50 most frequent words in text/book

Lets check frequency distributions of 'The Book of Genesis'

1from nltk.book import*
2
3fdist1 = FreqDist(text3)
4print(fdist1)
5print fdist1.most_common(50)

Here is the frequency distributions of the text3 ('The Book of Genesis')


image


Long words


Listing words that are more than 12 characters long. For each word w in the vocabulary V, we check whether len(w) is greater than 12;


1from nltk.book import*
2
3V = set(text3)
4long_words = [w for w in V if len(w) >12]
5print sorted(long_words)

Here are all words from the chat corpus that are longer than 8 characters, that occur more than 10 times


1sorted(w for w in set(text3) if len(w) >8and fdist3[w] >10)

image


Collocation


A collocation is a sequence of words that occur together unusually often. Thus red wine is a collocation, whereas the wine is not. To get a handle on collocations, we start off by extracting from a text a list of word pairs, also known as bigrams. This is easily accomplished with the function bigrams():


In particular, we want to find bigrams that occur more often than we would expect based on the frequency of the individual words. The collocations() function does this for us


1from nltk.book import*
2
3phase = text3[:5]
4print"===Bigrams==="
5print list(bigrams(phase))
6print"===Collocations==="
7print text3.collocations()

Here is out put of the sample code


image


  • fdist = FreqDist(samples)
    create a frequency distribution containing the given samples

  • fdist[sample] += 1
    increment the count for this sample

  • fdist['monstrous']
    count of the number of times a given sample occurred

  • fdist.freq('monstrous')
    frequency of a given sample

  • fdist.N()
    total number of samples

  • fdist.most_common(n)
    the n most common samples and their frequencies

  • for sample in fdist:
    iterate over the samples

  • fdist.max()
    sample with the greatest count

  • fdist.tabulate()
    tabulate the frequency distribution

  • fdist.plot()
    graphical plot of the frequency distribution

  • fdist.plot(cumulative=True)
    cumulative plot of the frequency distribution

  • fdist1 |= fdist2
    update fdist1 with counts from fdist2

  • fdist1 < fdist2
    test if samples in fdist1 occur less frequently than in fdist2

NLTK tutorial–03 (n-gram)

$
0
0

An n-gram is a contiguous sequence of n items from a given sequence of text or speech. The items can be syllables, letters, words or base pairs according to the application. n-grams may also be called shingles.

Tokenization

My first post was mainly on this.

1from nltk.tokenize import RegexpTokenizer
2
3tokenizer = RegexpTokenizer("[a-zA-Z'`]+")
4#skipping the numbers in here, include ' for tokens
5print tokenizer.tokenize("I am Madhuka Udantha, I'm going to write 2blog posts")
6#==>['I', 'am', 'Madhuka', 'Udantha', "I'm", 'going', 'to', 'write', 'blog', 'posts']
7

Generating N-grams for each token


nltk.util.ngrams(sequence, n, pad_left=False, pad_right=False, pad_symbol=None).


  • sequence –  the source data to be converted into ngrams (sequence or iter)

  • n  – the degree of the ngrams (int)

  • pad_left  – whether the ngrams should be left-padded (bool)

  • pad_right  – whether the ngrams should be right-padded (bool)

  • pad_symbol – the symbol to use for padding (default is None, any)

1from nltk.util import ngrams
2
3print list(ngrams([1,2,3,4,5], 3))
4print list(ngrams([1,2,3,4,5], 2, pad_right=True))
5print list(ngrams([1,2,3,4,5], 2, pad_right=True,pad_symbol="END"))

image


Counting each N-gram occurrences


1ngrams_statistics = {}
2
3for ngram in ngrams:
4ifnot ngrams_statistics.has_key(ngram):
5 ngrams_statistics.update({ngram:1})
6else:
7 ngram_occurrences = ngrams_statistics[ngram]
8 ngrams_statistics.update({ngram:ngram_occurrences+1})
9

Sorting


1ngrams_statistics_sorted = sorted(ngrams_statistics.iteritems(), reverse=True)
2print ngrams_statistics_sorted

image

Adding Configuration file for Python

$
0
0

'configuration files' or 'config files' configure the initial settings for some computer programs. They are used for user applications. Files can be changed as needed. An administrator can control which protected resources an application can access, which versions of assemblies an application will use, and where remote applications and objects are located. It is important to have config files in your applications. Let look at how to implement python config file.

The 'ConfigParser' module has been renamed to 'configparser' in Python 3. The 2to3 tool will automatically adapt imports when converting your sources to Python 3. This post I will be using Python 2. The ConfigParser class implements a basic configuration file parser language which provides a structure similar to what you would find on Microsoft Windows INI files.

1. We have to create two files. config file and python file to read this config. (Both are locate in same directory for this sample. you can locate in directory when you need)

  • student.ini
  • configure-reader.py

2. Add some data for configure files

The configuration file consists of sections, led by a [section] header and followed by name: value entries. Lines beginning with '#' or ';' are ignored and may be used to provide comments. Here we can below lines for configure file

1[SectionOne]
2Name: James
3Value: Yes
4Age: 30
5Status: Single
6Single: True
7
8
9[SectionTwo]
10FavouriteSport=Football
11[SectionThree]
12FamilyName: Johnson
13
14[Others]
15Route: 66

3. Let try to read this configure files in python


1import os
2import ConfigParser
3
4path = os.path.dirname(os.path.realpath(__file__))
5Config = ConfigParser.ConfigParser()
6Config.read(path+"\\student.ini")
7print Config.sections()
8#==>['Others', 'SectionThree', 'SectionOne', 'SectionTwo']

4. Let modify the code more standard with function.


1import os
2import ConfigParser
3
4path = os.path.dirname(os.path.realpath(__file__))
5Config = ConfigParser.ConfigParser()
6Config.read(path+"\\student.ini")
7
8
9def ConfigSectionMap(section):
10 dict1 = {}
11 options = Config.options(section)
12for option in options:
13try:
14 dict1[option] = Config.get(section, option)
15if dict1[option] ==-1:
16 DebugPrint("skip: %s"% option)
17except:
18print("exception on %s!"% option)
19 dict1[option] = None
20return dict1
21
22Name = ConfigSectionMap("SectionOne")['name']
23Age = ConfigSectionMap("SectionOne")['age']
24Sport = ConfigSectionMap("SectionTwo")['favouritesport']
25print"Hello %s. You are %s years old. %s is your favourite sport."% (Name, Age,Sport)

image


It is you time too. Play more with it.

Grammar induction

$
0
0

Few days I was working for pattern mining on huge files and came across with millions of pattern (even different length from 2 to 150).  Now I am looking for regex generation algorithms and came across by ‘Grammar induction’ which we knew some thing when in university time. But this is much more Smile to do.

Grammar induction

Grammar induction, also known as grammatical inference or syntactic pattern recognition, refers to the process in machine learning of learning a formal grammar (usually as a collection of re-write rules or productions or alternatively as a finite state machine or automaton). There is now a rich literature on learning different types of grammar and automata, under various different learning models and using various different methodologies. So researcher need to go back for book and read them .
Grammatical inference[1] has often been very focused on the problem of learning finite state machines of various types (Induction of regular languages), since there have been efficient algorithms for this problem since the 1980s.A more recent textbook is de la Higuera (2010) [1] which covers the theory of grammatical inference of regular languages and finite state automata. More recently these approaches have been extended to the problem of inference of context-free grammars and richer formalisms, such as multiple context-free grammars and parallel multiple context-free grammars. Other classes of grammars for which grammatical inference has been studied are contextual grammars, and pattern languages. Here is some summary of the topic

  • Grammatical inference by genetic algorithms[2]
  • Grammatical inference by greedy algorithms
    • Context-free grammar generating algorithms
      • Lempel-Ziv-Welch algorithm[3]
      • Sequitur
  • Distributional Learning algorithms
    • Context-free grammars languages
    • Mildly context-sensitive languages

Induction of regular languages
Induction of regular languages refers to the task of learning a formal description (e.g. grammar) of a regular language from a given set of example strings. Language identification in the limit[4] is a formal model for inductive inference. A regular language is defined as a (finite or infinite) set of strings that can be described by one of the mathematical formalisms called "finite automaton", "regular grammar", or "regular expression", all of which have the same expressive power. A regular expression can be

  • ∅ (denoting the empty set of strings),
  • ε (denoting the singleton set containing just the empty string),
  • a (where a is any character in Σ; denoting the singleton set just containing the single-character string a),
  • r+s (where r and s are, in turn, simpler regular expressions; denoting their set's union)
  • rs (denoting the set of all possible concatenations of strings from r's and s's set),
  • r+ (denoting the set of n-fold repetitions of strings from r's set, for any n≥1), or
  • r* (similarly denoting the set of n-fold repetitions, but also including the empty string, seen as 0-fold repetition).

The largest and the smallest set containing the given strings, called the trivial overgeneralization and under-generalization respectively.

Brill[5] Reduced regular expressions

  • a (where a is any character in Σ; denoting the singleton set just containing the single-character string a),
  • ¬a (denoting any other single character in Σ except a),
  • • (denoting any single character in Σ)
  • a*, (¬a)*, or •* (denoting arbitrarily many, possibly zero, repetitions of characters from the set of a, ¬a, or •, respectively), or
  • rs (where r and s are, in turn, simpler reduced regular expressions; denoting the set of all possible concatenations of strings from r's and s's set).

Given an input set of strings, he builds step by step a tree with each branch labeled by a reduced regular expression accepting a prefix of some input strings, and each node labelled with the set of lengths of accepted prefixes[5]. He aims at learning correction rules for English spelling errors, rather than at theoretical considerations about learnability of language classes. Consequently, he uses heuristics to prune the tree-buildup, leading to a considerable improvement in run time.

[1] de la Higuera, Colin (2010). Grammatical Inference: Learning Automata and Grammars. Cambridge: Cambridge University Press.

[2] Dupont, Pierre. "Regular grammatical inference from positive and negative samples by genetic search: the GIG method."Grammatical Inference and Applications. Springer Berlin Heidelberg, 1994. 236-245.

[3] Batista, Leonardo Vidal, and Moab Mariz Meira. "Texture classification using the Lempel-Ziv-Welch algorithm."Advances in Artificial Intelligence–SBIA 2004. Springer Berlin Heidelberg, 2004. 444-453.

[4] Gold, E. Mark (1967). "Language identification in the limit". Information and Control 10 (5): 447–474.

[5] Eric Brill (2000). "Pattern–Based Disambiguation for Natural Language Processing". Proc. EMNLP/VLC


Google Chart with AngularJS

$
0
0

Google Charts provides many chart types that is useful for data visualization. Charts are highly interactive and expose events that let you connect them to create complex dashboards. Charts are rendered using HTML5/SVG technology to provide cross-browser compatibility. All chart types are populated with data using the DataTable class, making it easy to switch between chart types. Google chart contains main five elements

  • Chart has type
  • Chart has data. Different data fomat will have for some charts but basic format will be same.
  • Chart contains css style
  • Chart has options where it says chart title, axis labels
  • Chart format will focus on color format, date format and number format


Here I am trying to have one data set and try to switch my charts.
In data you will have columns and rows (first element will be the label).

1chart.data = {"cols": [
2 {id:"month", label:"Month", type:"string"},
3 {id:"usa-id", label:"USA", type:"number"},
4 {id:"uk-id", label:"UK", type:"number"},
5 {id:"asia-id", label:"Asia", type:"number"},
6 {id:"other-id", label:"Other", type:"number"}
7 ], "rows": [
8 {c: [
9 {v:"January"},
10 {v:22, f:"22 Visitors from USA"},
11 {v:12, f:"Only 12 Visitors from UK"},
12 {v:15, f:"15 Asian Visitors"},
13 {v:14, f:"14 Others"}
14 ]},
15 {c: [
16 {v:"February"},
17 {v:14},
18 {v:33, f:"Marketing has happen"},
19 {v:28},
20 {v:6}
21 ]},
22 {c: [
23 {v:"March"},
24 {v:22},
25 {v:8, f:"UK vacation"},
26 {v:11},
27 {v:0}
28
29 ]}
30 ]};
31

First we need to added google chart  for your angular project then to the html file.


1. Added "angular-google-chart": "~0.0.11" into the “dependencies” of the package.json


2. Added ‘ng-google-chart.js’  file for html page, and define a “div” for chart


<script src="..\node_modules\angular-google-chart\ng-google-chart.js"></script>


<div google-chart chart="chart" style="{{chart.cssStyle}}"/>


3. Build the Controller


1angular.module('google-chart-example', ['googlechart']).controller("ChartCtrl", function ($scope) {
2var chart1 = {};
3
4
5 chart1.type = "BarChart";
6 chart1.cssStyle = "height:400px; width:600px;";
7 //used chart.data that I have show in above script
8 chart1.data = {"cols": [
9 //labels and types
10 ], "rows": [
11 //name and values
12 ]};
13
14 chart1.options = {
15"title": "Website Visitors per month",
16"isStacked": "true",
17"fill": 20,
18"displayExactValues": true,
19"vAxis": {
20"title": "Visit Count", "gridlines": {"count": 6}
21 },
22"hAxis": {
23"title": "Date"
24 }
25 };
26
27 chart1.formatters = {};
28
29 $scope.chart = chart1;
30
31});

4. Let add few button for switching charts.


1<button ng-click="switch('ColumnChart')">ColumnChart</button>
2<button ng-click="switch('BarChart')">BarChart</button>
3<button ng-click="switch('AreaChart')">AreaChart</button>
4<button ng-click="switch('PieChart')">PieChart</button>
5<button ng-click="switch('LineChart')">LineChart</button>
6<button ng-click="switch('CandlestickChart')">CandlestickChart</button>
7<button ng-click="switch('Table')">Table</button>

5. Now add the function for do the axis transformation and chart switching


1$scope.switch=function (chartType) {
2 $scope.chart.type=chartType;
3 AxisTransform()
4};
5
6AxisTransform =function () {
7 tempvAxis = $scope.chart.options.vAxis;
8 temphAxis = $scope.chart.options.hAxis;
9 $scope.chart.options.vAxis = temphAxis;
10 $scope.chart.options.hAxis = tempvAxis;
11};

6. Here we go!!!


imageimage


imageimageimageimage

Options for Google Charts

$
0
0

In Google chart some different chart type contains different format of data sets

Google Chart Tools is with their default setting and all customizations are optional. Every chart exposes a number of options that customize its look and feel. These options are expressed as name:value pairs in the options object.
eg:
visualization supports a colors option that lets you specify

"colors": ['#e0440e', '#e6693e', '#ec8f6e', '#f3b49f', '#f6c7b6']

image

Lets create function to pass those

1AddNewOption =function (name,value) {
2 options = $scope.chart.options
3 $scope.chart.options[name] = value;
4};

Now use this option to improve our scatter chart


1AddNewOption('pointShape','square');
2AddNewOption('pointSize',20);

imageimage


Now we can do more play with Google chart options.


Crosshair Options


Crosshairs can appear on focus, selection, or both. They're available for scatter charts, line charts, area charts, and for the line and area portions of combo charts.


When you hover over the points with crosshair option you can see some helping axis for the point. 


image


Here is crosshair API for to play more.


  • crosshair: { trigger: 'both' }
    display on both focus and selection

  • crosshair: { trigger: 'focus' }
    display on focus only

  • crosshair: { trigger: 'selection' }
    display on selection only

  • crosshair: { orientation: 'both' }
    display both horizontal and vertical hairs

Chart Types and Data Models in Google Charts

$
0
0
Different data model is need for different chart types. This post is basically covering google chart types and support of data models.

Bar charts and Column chart
Each bar of the chat represent the value of elements of x-axis. Bar charts display tooltips when the user hovers over the data. For a vertical version of this chart called the 'column chart'.
Each row in the table represents a group of bars.
  • Column 0 : Y-axis group labels (string, number, date, datetime)
  • Column 1 : Bar 1 values in this group (number)
  • Column n : Bar N values in this group (number)


Area chart
An area chart or area graph displays graphically quantities data. It is based on the line chart. The area between axis and line are commonly emphasized with colors, textures and hatchings.
Each row in the table represents a set of data points with the same x-axis location.
  • Column 0 : Y-axis group labels (string, number, date, datetime)
  • Column 1 : Line 1 values (number)
  • Column n : Line n values (number)


Scatter charts
Scatter charts plot points on a graph. When the user hovers over the points, tooltips are displayed with more information.


Each row in the table represents a set of data points with the same x-axis value.
  • Column 0 : Data point X values (number, date, datetime)
  • Column 1 : Series 1 Y values (number)
  • Column n : Series n Y values (number)
(This is only fake sample data for chart representing)


Bubble chart
A bubble chart is used to visualize a data set with two to four dimensions. The first two dimensions are visualized as coordinates, the third as color and the fourth as size.
  • Column 0 : Name of the bubble (string)
  • Column 1 : X coordinate (number)
  • Column 2 : Y coordinate (number)
  • Column 3 : It is optional. A value representing a color on a gradient scale  (string, number)
  • Column 4 : It is optional. A Size - values in this column (number)


Bubble Name is  "January"
X =  22
Y =  12
Color = 15
Size  = 14


Summary Of the Data model and Axis in chart types.

The major axis is the axis along the natural orientation of the chart. For line, area, column, combo, stepped area and candlestick charts, this is the horizontal axis. For a bar chart it is the vertical one. Scatter and pie charts don't have a major axis. The minor axis is the other axis.
The major axis of a chart can be either discrete or continuous. When using a discrete axis, the data points of each series are evenly spaced across the axis, according to their row index. When using a continuous axis, the data points are positioned according to their domain value. The labeling is also different. In a discrete axis, the names of the categories. In a continuous axis, the labels are auto-generated.
Axes are always continuous
  • Scatter
  • Bubble charts
Axes are always discrete
  • The major axis of stepped area charts (and combo charts containing such series).

In line, area, bar, column and candlestick charts (and combo charts containing only such series), you can control the type of the major axis:

  • For a discrete axis, set the data column type to string.
  • For a continuous axis, set the data column type to one of: number, date, datetime.

Workflows for Git

$
0
0
There are many Workflows for Git

  • Centralized Workflow
  • Feature Branch Workflow
  • Gitflow Workflow
  • Forking Workflow


In Centralized Workflow, Team develop projects in the exact same way as they do with Subversion. Git to power your development workflow presents a few advantages over SVN. First, it gives every developer their own local copy of the entire project. This isolated environment lets each developer work independently of all other changes to a project—they can add commits to their local repository and completely forget about upstream developments until it's convenient for them.

Feature Branch Workflow is that all feature development should take place in a dedicated branch instead of the master branch. This encapsulation makes it easy for multiple developers to work on a particular feature without disturbing the main codebase. It also means the master branch will never contain broken code.

Gitflow Workflow provides a robust framework for managing larger projects. it assigns very specific roles to different branches and defines how and when they should interact. You also get to leverage all the benefits of the Feature Branch Workflow.

The Forking Workflow is fundamentally different than the other workflows. Instead of using a single server-side repository to act as the “central” codebase, it gives every developer a server-side repository. Developers push to their own server-side repositories, and only the project maintainer can push to the official repository. The result is a distributed workflow that provides a flexible way for large, organic teams (including untrusted third-parties) to collaborate securely. This also makes it an ideal workflow for open source projects.

Git simple Feature Branch Workflow

$
0
0
In my previous post, I wrote about git work flows. Now I will going to try out simple 'Feature Branch Workflow'.
1. I pull down the latest changes from master
git checkout master
git pull origin master

2. I make branch to make changes 
git checkout -b new-feature

3. Now I am working on the feature

4. I keep my feature branch fresh and up to date with the latest changes in master, using 'rebase'
Every once in a while during the development update the feature branch with the latest changes in master.

git fetch origin
git rebase origin/master

In the case where other devs are also working on the same shared remote feature branch, also rebase changes coming from it:

git rebase origin/new-feature

Resolving conflicts during the rebase allows me to have always clean merges at the end of the feature development.

5. When I am ready I commit my changes
git add -p
git commit -m "my changes"

6. rebasing keeps my code working, merging easy, and history clean.
git fetch origin
git rebase origin/new-feature
git rebase origin/master

Below two points are optional
6.1 push my branch for discussion (pull-request)
git push origin new-feature

6.2 feel free to rebase within my feature branch, my team can handle it!
git rebase -i origin/master

Few point that can be happen in developing phase.
Another new feature is needed and it need some commits from my new branch 'new-feature' that new feature need new branch and few commits need to push to it and clean from my branch.

7.1 Creating x-new-feature branch on top of 'new-feature'
git checkout -b x-new-feature  new-feature

7.2 Cleaning commits
//revert a commit
git revert --no-commit
//reverting few steps a back from current HEAD
git reset --hard HEAD~2

7.3 Updating the git
//Clean new-feature branch
git push origin HEAD --force

Generate a AngularJS application with grunt and bower

$
0
0
1. Install grunt, bower, yo.. etc. If you have miss any.
npm install -g grunt-cli bower yo generator-karma generator-angular

Yeoman is used to generate the scaffolding of your app.
Grunt is a powerful, feature rich task runner for Javascript.

2. Install the AngularJS generator:
npm install -g generator-angular

3. Generate a new AngularJS application.
yo angular

The generator will ask you a couple of questions. Answer them as you need.

4. Install packages/libs  
bower install angular-bootstrap --save
bower install angular-google-chart --save

5. Start the server.
npm start
grunt server


Data validation

$
0
0

Data validation is a process of ensuring that a program operates on clean, correct and useful data. Data validation provide certain well-defined guarantees for fitness, accuracy, and consistency for user/stream/data input into an application. It can designed using various methodologies, and be deployed in any of various contexts.

Data-Validation

Different kinds of data validation

  • Data type validation
    It carried out on one or more simple data fields. data field is consistent with expected data type (such as number, string, etc.)
  • Range and constraint validation
    Data is consist with a minimum/maximum range, or with a evaluating a sequence of characters
  • Code and Cross-reference validation
    Code and cross-reference validation includes tests for data type validation, combined with one or more operations to verify the data by with supplied data or known look-up table
  • Structured validation
    It allows for the combination of any of various basic data type validation steps, along with more complex processing steps. It can handle complex data objects.

Zeppelin Docs

$
0
0

Install Ruby Version Manager (rvm)

curl -L https://get.rvm.io | bash -s stable --ruby

Then check which rubies are installed by using

rvm list

ruby -v

you can then switch ruby versions using

rvm use 1.9.3 --default

If not install you can install by

rvm install ruby-1.9.3-p551

Now we have correct version start building app

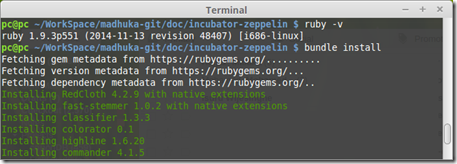
gem install bundler

bundle install

Screenshot from 2015-08-11 15_37_41

To start serve

bundle exec jekyll serve –watch

Screenshot from 2015-08-11 15_37_18

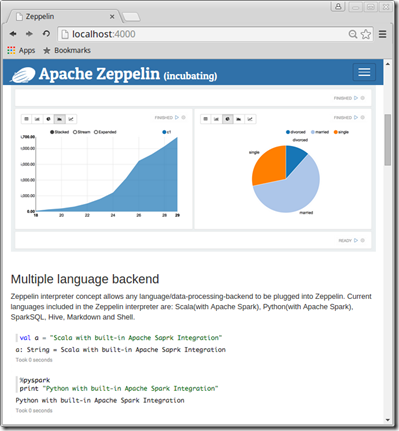
Then go to below URL

http://localhost:4000/

Screenshot from 2015-08-11 15_39_37

Tutorial with Map Visualization in Apache Zeppelin

$
0
0

Zeppelin is using leaflet which is an open source and mobile friendly interactive map library.

Before starting the tutorial you will need dataset with geographical information. Dataset should contain location coordinates representing, longitude and latitude. Here the online csv file will be used for the next steps. Here I am sharing sample dataset in gist.

1import org.apache.commons.io.IOUtils
2import java.net.URL
3import java.nio.charset.Charset
4
5
6// load map data
7val myMapText = sc.parallelize(
8 IOUtils.toString(
9new URL("https://gist.githubusercontent.com/Madhuka/74cb9a6577c87aa7d2fd/raw/2f758d33d28ddc01c162293ad45dc16be2806a6b/data.csv"),
10 Charset.forName("utf8")).split("\n"))

Refine Data


Next to transform data from csv format into RDD of Map objects, run the following script. This will remove the csv headers using filter function.


1caseclass Map(Country:String, Name:String, lat :Float, lan :Float, Altitude :Float)
2
3val myMap = myMapText.map(s=>s.split(",")).filter(s=>s(0)!="Country").map(
4 s=>Map(s(0),
5 s(1),
6 s(2).toFloat,
7 s(3).toFloat,
8 s(4).toFloat
9 )
10
11
12// Below line works only in spark 1.3.0.
13// For spark 1.1.x and spark 1.2.x,
14// use myMap.registerTempTable("myMap") instead.
15myMap.toDF().registerTempTable("myMap")

Data Retrieval and Data Validation


Here is how the dataset is viewed as a table


map_dataset


Dataset can be vaildated by calling `dataValidatorSrv`. It will validate longitude and latitude. If any record is out of range it will point out the recordId and record value with a meaningful error message.


1var msg = dataValidatorSrv.validateMapData(data);


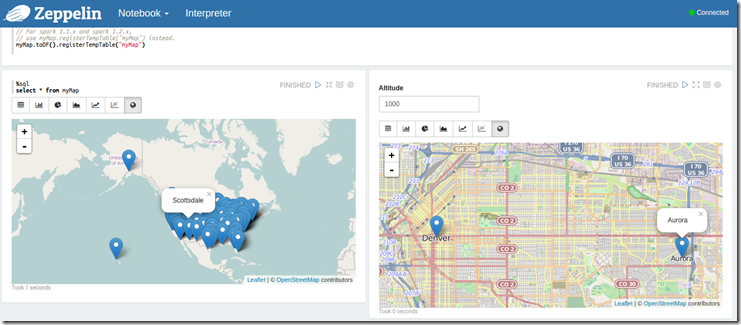
Now data distributions can be viewed on geographical map as below.


1%sql
2select*from myMap
3where Country ="${Country="United States"}

1%sql
2select*from myMap
3where Altitude > ${Altitude=300}

maps

Introducing New Chart Library and Types for Apache Zeppelin

$
0
0

Why Charts are important in zeppelin?
Zeppelin is mostly used for data analysis and visualization. Depending on the user requirements and datasets the types of charts needed could differ. So Zeppelin let user to add different chart libraries and chart types.


Add New Chart Library
When needed a new JS chart library than D3 (nvd3) which is included in zeppelin, a new JS library for zeppelin-web is added by adding name in zeppelin-web/bower.json

eg: Adding map visualization to Zeppelin using leaflet

"leaflet": "~0.7.3" for dependencies


Add New Chart Type

Firstly add a button to view the new chart. Append to paragraph.html (zeppelin-web/src/app/notebook/paragraph/paragraph.html) the following lines depending on the chart you use.

1<button type="button" class="btn btn-default btn-sm"
2 ng-class="{'active': isGraphMode('mapChart')}"
3 ng-click="setGraphMode('mapChart', true)"><i class="fa fa-globe"></i>
4</button>

After successful addition the zeppelin user will be able to see a new chart button added to the button group as follows.


new_map_button


Defining the chart area


Defining the chart area of the new chart type.
To define the chart view of the new chart type add the following lines to paragraph.html


1<div ng-if="getGraphMode()=='mapChart'"
2 id="p{{paragraph.id}}_mapChart">
3<leaflet></leaflet>
4</div>

Setup the chart data


Different charts have different attributes and features. To handle such features of the new chart type map those behaviors and features in the function `setGraphMode()` in the file paragraph.controller.js as follows.


1if (!type || type ==='mapChart') {
2//setup new chart type
3}

The current Dataset can be retrieved by `$scope.paragraph.result` inside the `setGraphMode()` function.


Best Practices for setup a new chart.


A new function can be used to setup the new chart types. Afterwards that function could be called inside the `setMapChart()` function.


Here is sample code setting map chart type


1var setMapChart =function(type, data, refresh) {
2//adding markers for map
3 newmarkers = {};
4for (var i =0; i < data.rows.length; i++) {
5var row = data.rows[i];
6var rowMarker = mapChartModel(row);
7 newmarkers = $.extend(newmarkers, rowMarker);
8 }
9 $scope.markers = newmarkers;
10// adding map bounds
11var bounds = leafletBoundsHelpers.createBoundsFromArray([
12 [Math.max.apply(Math, latArr), Math.max.apply(Math, lngArr)],
13 [Math.min.apply(Math, latArr), Math.min.apply(Math, lngArr)]
14 ]);
15 $scope.bounds = bounds;
16}

Zeppelin Data Validation Service

$
0
0

Data Validation

Data validation is a process of ensuring data in zeppelin is clean, correct and according to the data schema model. Data validation provides certain well-defined rule set for fitness, and consistency checking for zeppelin charts. Here is more about data validation types.

Where the data validator is used  in zeppelin?

Data validator is used in zeppelin before drawing charts or analyzing data.

Why the data validator is used?

In drawing charts you can validate dataset if under validate data model schema, example. Before visualizing the dataset in charts, dataset needs to validated against data model schema for a particular chart type.
This is because different chart types have different data models. eg: Pie charts, Bar charts and Area charts have label and a number. Scatter charts and Bubble charts have two numbers for x axis and y axis at minimum in their data models.

Why the data validator is important?

When user request to draw any visualization of a dataset, data validation services will run through the dataset and check if the dataset is valid against the data schema. If unsuccess it will give a message which record is mismatched against the data schema. So the user gets a more accurate visualization and correct decision finally. Also researchers and data analytics use it to verify the dataset is clean and the preprocessing is done correctly.

How Data Validation is done?

Data Validation consists of service, factories and configs.Data Validation is exposed as Angular services. Data validation factory, which is extendable contains functional implementation. Schemas are defined as constants in config. It contains basic data type validation by default

Developers can introduce new data validation factories for their chart types by extending data validator factory. If a new chart consists of the same data schema existing data validators can be used.

How to used existing Data Validation services
Zeppelin Data Validation is exposed as service in Zeppelin Web application. It can be called and the dataset can be passed as a parameter.

`dataValidatorSrv.<dataModelValidateName>(data);`

This will return a message as below

{
  'error': true / false,
  'msg': 'error msg / notification msg'
}

How to Add New Data Validation Schema

Data Validation is implemented as factory model. Therefore customized Data Validation factory can be created by extending `DataValidator` (zeppelin-web/src/components/data-validator/data-validator-factory.js)

Data model schema in 'dataModelSchemas' can be configured.

'MapSchema': {
  type: ['string', 'string', 'number', 'number', 'number']
}

If beyond data type validation is needed a function for validating the record can be introduced. If Range and constraint validation, Code and Cross-reference validation or Structured validation are needed they can be added to the Data Validation factory.


How to Expose New Data Validation Schema in Service
After adding a new data validation factory it needs to be exposed in `dataValidatorSrv` (zeppelin-web/src/components/data-validator/data-validator-service.js)

1this.validateMapData =function(data) {
2var mapValidator = mapdataValidator;
3 doBasicCheck(mapValidator,data);
4//any custom validation can be called in here
5return buildMsg(mapValidator);
6 };

Adding new Data Range Validation


Data Range Validation is important with regard to some datasets. As an example Geographic Information dataset  will contain geographic coordinates, Latitude measurements ranging from 0° to (+/–)90° and Longitude measurements ranging from 0° to (+/–)180°. All the values of Latitude and Longitude must to be inside a particular range. Therefore you can define range in schema and range validation function for factory as below.


Adding range for `MapSchema`


1'MapSchema': {
2type: ['string', 'string', 'number', 'number', 'number'],
3range: {
4latitude: {
5low: -90,
6high:90
7 },
8longitude: {
9low: -180,
10high:180
11 }
12 }
13}

Validating latitude in `mapdataValidator` factory


1//Latitude measurements range from 0° to (+/–)90°.
2function latitudeValidator(record, schema) {
3 var latitude = parseFloat(record);
4 if (schema.latitude.low < latitude && latitude < schema.latitude.high) {
5 msg += 'latitudes are ok | ';
6 } else {
7 msg += 'Latitude ' + record + ' is not in range | ';
8 errorStatus = true;
9 }
10}

Few other sample validators can be found in zeppelin-web/src/components/data-validator/ directory

Packaging and Distributing Python Projects

$
0
0

Requirements

Wheel: It is a built package that can be installed without the build proces
pip install wheel

Twine : It is a utility for interacting with PyPI
pip install twine

Configuring a Project

Here are files that will needed in root level.

setup.py : It contains a global setup() function. The keyword arguments to this function are how specific details of your project are defined.

1setup(
2 name='sample',
3
4# Versions should comply with PEP440.
5 version='1.0.0',
6
7 description='A sample Python project',
8# url, author, author_email, license
9
10# See https://pypi.python.org/pypi?%3Aaction=list_classifiers
11 classifiers=[
12# How mature is this project? Common values are (Alpha, Beta, Production)
13'Development Status :: 3 - Alpha',
14
15# that you indicate whether you support Python 2, Python 3 or both.
16'Programming Language :: Python :: 2.7',
17 ],
18
19 keywords='sample module',
20
21# List run-time dependencies here
22 install_requires=['peppercorn'],
23
24# List additional groups of dependencies here (e.g. development dependencies).
25 extras_require={
26'dev': ['check-manifest'],
27'test': ['coverage'],
28 },
29
30# If there are data files included in your packages
31 package_data={
32'sample': ['package_data.dat'],
33 },
34
35# Place data files outside of your packages
36 data_files=[('my_data', ['data/data_file'])],
37
38# To provide executable scripts
39 entry_points={
40'console_scripts': [
41'sample=sample:main',
42 ],
43 },
44)
45

setup.cfg : It is ini file that contains option defaults for setup.py


README.rst : It is readme for the project


MANIFEST.in : Where you need to package additional files


Package (Folder) :  Most common practice to is to include all python modules and packages under a single top-level package that has the same name as the project


Building


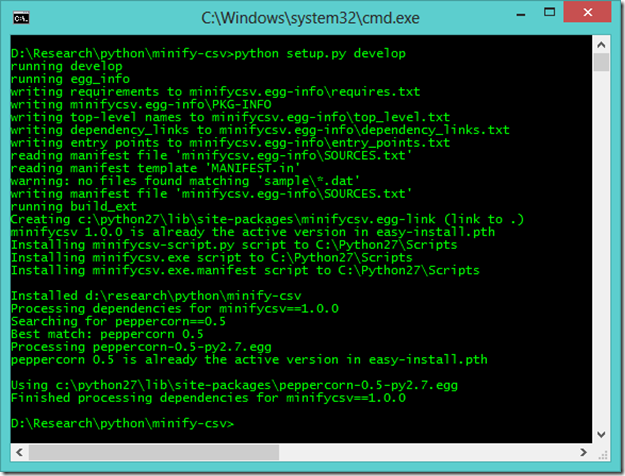
Development Mode


  • python setup.py develop

This will install any dependencies declared with “install_requires” and also any scripts declared with “console_scripts”.


image


Packaging Project


Source Distributions


  • python setup.py sdist

image


To build a Universal Wheel:


  • python setup.py bdist_wheel --universal

Pure Python Wheels


  • python setup.py bdist_wheel

Install for windows


  • python setup.py bdist_wininst

Now you can share and install  it in windows easy with wizard as below


image


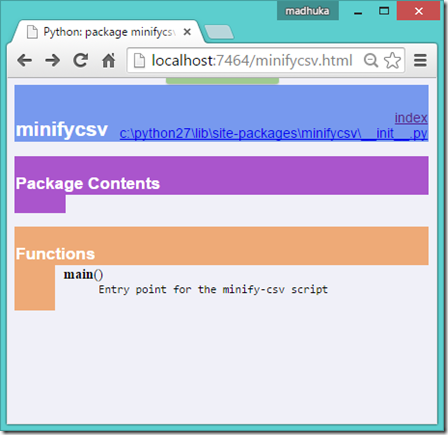
Now Check Index of Modules from : http://localhost:7464/


image


You can find you new modules in here


image


you can used it in python now as module as below and you can share it with other developers.


1import minifycsv
2
3#using minifycsv
4minifycsv.main()

Next we can see uploading the Project to PyPI.

Viewing all 213 articles
Browse latest View live


Latest Images